Table of contents
Table of contents- Supply Chain KPIs For Better Business Results
- Supply Chain KPIs
- What are supply chain KPIs?
- 10 supply chain KPIs examples
- The impact of meaningful Supply chain KPIs: A real customer example
- 5 critical inventory management KPIs
- Where do inventory management KPIs fit in the KPI pyramid?
- Supply chain KPIs takeaways
- Supply chain kpis FAQs
Overview
Supply Chain Key Performance Indicators (KPIs) are crucial metrics for measuring and improving the effectiveness of a supply chain, aiding in decision-making and ensuring product availability and customer satisfaction. Common examples include perfect order rate, on-time delivery and forecast accuracy. Inventory management KPIs, a subset focusing on stock levels, include inventory turnover ratio and days of supply.
Supply Chain KPIs
“What cannot be measured cannot be improved.” This timeless adage rings true for virtually every business process, including, of course, inventory management.
By embracing this concept and recognising that continuous improvement is a fundamental principle for any top-notch supply chain leader, inventory management KPIs become essential.
What are supply chain KPIs?
A key performance indicator (KPI) is a crucial performance measure that involves a set of metrics. These are used to capture insight into the effectiveness and productivity of business actions. Moreover, its very definition outlines the business objectives.
When we apply this concept to inventory management, the KPI serves as a measure of our performance in this area. It indicates how well we are meeting our objectives in terms of supply chain management.
How to define supply chain KPIs
Key Performance Indicators (KPIs) are metrics used to evaluate the performance and effectiveness of various aspects of a supply chain. Supply chain KPIs help organisations measure their efficiency, identify areas for improvement, and make data-driven decisions to optimise their supply chain processes.
In essence, KPIs should underpin the cornerstone of effective supply chain management:
To provide smooth materials flow throughout the supply chain.
To underpin effective decision-making throughout the end-to-end supply chain
To guarantee product availability.
UNDERPIN EFFECTIVE DECISION-MAKING THROUGHOUT THE END-TO-END SUPPLY CHAIN GUARANTEE PRODUCT AVAILABILITY & ENSURE CUSTOMER SATISFACTION

10 supply chain KPIs examples
The specific KPIs may vary depending on the industry, company objectives, and the nature of the supply chain, but some common supply chain KPIs include:
- Perfect Order Rate (POR): This metric calculates the percentage of orders that are delivered without any errors, such as incorrect products, quantity discrepancies, or damages.
- On-Time Delivery (OTD): On-time delivery (OTD) measures the percentage of orders or shipments that are delivered to customers on or before the agreed-upon or promised delivery date. It assesses the supply chain’s ability to fulfil customer orders within the specified time frame, ensuring that products or services reach customers as scheduled, without delays.
- Order Fulfilment Cycle Time: As a measure of fulfilment efficiency, order fulfilment cycle Time measures the time taken from receiving an order to delivering the product to the customer. A shorter cycle time suggests better efficiency in fulfilling orders.
- Lead Time: This measures the time taken from placing an order with a supplier to receiving the goods. A shorter lead time generally means a more responsive supply chain.
- Supplier On-Time Delivery: Supplier on-time delivery evaluates the percentage of orders delivered on time by suppliers.
- Cash-to-Cash Cycle Time (C2C): Cash-to-cash cycle time Measures the time it takes for a company to convert its working capital investment in inventory back to cash through sales. A shorter C2C cycle indicates better cash flow management.
- Supply Chain Cost: The metric explores the total cost associated with running the supply chain, including procurement, transportation, warehousing, and distribution costs.
- Warehouse Utilisation: This KPI metric evaluates the efficiency of warehouse space usage, indicating how efficiently the available space is utilised for storage and distribution.
- Backorder Rate: Backorder rate measures the percentage of customer orders that cannot be fulfilled immediately due to insufficient inventory.
- Forecast Accuracy: This metric evaluates the accuracy of demand forecasts compared to actual sales. A high forecast accuracy helps avoid excess inventory or stockouts.
The impact of meaningful Supply chain KPIs: A real customer example
For over 40 years, Nisa has strived to deliver everything independent retailers need to thrive in the increasingly competitive grocery marketplace.
With a growing network of 4000 independent stores and over 1400 partners across the UK, Nisa is committed to providing an exceptional level of service and unrivalled levels of availability.
However, as Nick Stockdale, Head of Supply Chain at Nisa, highlights: “We are always looking for ways we can improve product availability, reduce costs and add value to our customers. However, with complex demand streams and an ever-growing assortment, we needed to take steps to streamline our operation.”
Since joining forces with Slimstock, Nisa has restructured its businesses as well updated many of its KPIs.
Explaining how the successful implementation of Slim4 helped the planning team to gain a clearer picture of its performance, Louise adds: “We can now easily track demand streams from our retail, bulk & pre-sale operation. As a result, we can now align our purchasing decisions with the strategic focus of the business.”
5 critical inventory management KPIs
Whereas supply chain KPIs focus on evaluating the overall performance of the entire supply chain, inventory KPIs primarily revolve around the management and control of inventory levels within a company. Here are a few examples of some on the most common inventory management metrics:
Inventory Turnover Ratio (ITR)
The ITR (inventory turnover ratio) helps gauge how often stock inventory needs to be sold or converted. It indicates how often we can sell our inventory each year based on the working capital invested in inventory. To calculate the ITR, we use the following formula, dividing the cost of goods sold (COGS) by the average inventory investment.
Inventory turnover ratio = Cost of goods sold (COGS)/average inventory value.
Benchmark: There isn’t a specific benchmark for ITR (inventory turnover ratio). Product leaders in the spare parts market typically find an ITR of 3-4 satisfactory. Organisations that focus on operational excellence, like low-cost airlines or wholesalers, aim for an ITR of 8-9. Distributors dealing with a wide array of brands and striving to meet customer demands target an ITR of approximately 5-7. The choice of ITR value relates closely to the gross margin generated by the stock keeping units (SKUs).
Turn/Earn Index (TEI)
The TEI (turn/earn index) evaluates gross margin and turnover. The rationale behind TEI is to help optimise decisions around low-margin SKUs where you need high stock turnover. This metric also helps planning teams manage high-margin SKUs by maintaining an acceptable profitability level with a much lower stock turnover.
TEI = (ITR) x (% of gross profit) x 100
Benchmark: Achieving a TEI of between 150 and 180 would be ideal for balancing gross margin and inventory. For example, a TEI of 160 can be interpreted as having a 20% margin and rotating the inventory 8 times a year. It can also be interpreted as having a 40% margin and rotating the inventory 4 times a year.

Gross Margin Return on Investment (GMROI)
GMROI stands for gross margin return on investment. It measures the amount of gross profit earned for every pound or dollar invested in inventory. To calculate GMROI, you divide the gross profit by the average inventory investment.
Monitoring GMROI every month is crucial for understanding which SKU or brand generates the highest profit.
GMROI: Gross profit/Average inventory cost
Benchmark: Achieving a GMROI between 200 and 225 would be considered excellent in terms of generating substantial gross earnings. However, determining a target figure depends on the context of the business.
Days of Supply
Days of supply is a widely used KPI among inventory managers. It helps gauge supply chain efficiency. Its calculation involves dividing the average inventory on hand (in value) by the average monthly demand (in value) and then multiplying the result by thirty (if measured monthly).
Days of supply: Average inventory/Monthly demand x 30
Benchmark: There isn’t a specific target for days of supply. It depends on the business context. However, comparing it against the sales forecast for the upcoming months (in value) will provide valuable insight into maintaining the appropriate stock level for enhancing monthly inventory management.
It’s imperative to note that days of supply alone don’t indicate how well our inventory will align with demand. For that, we need to look at inventory velocity.
Where do inventory management KPIs fit in the KPI pyramid?
The KPI pyramid serves as a management tool to measure and evaluate the performance of an organisation, department, or project across various hierarchical levels.
This pyramid is designed with distinct levels of indicators, each offering varying degrees of detail and strategic significance (strategic, tactical, or operational).
In the context of inventory management KPIs, they can also be categorised based on their placement within the pyramid.
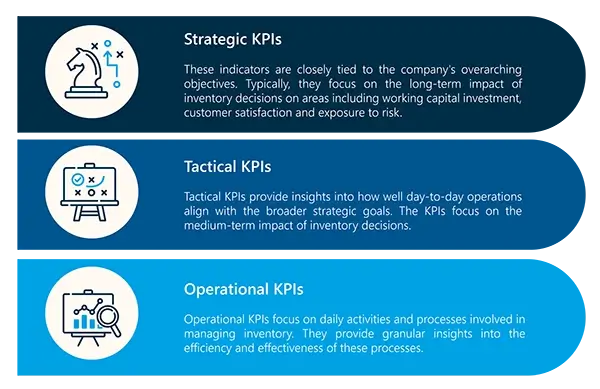
Strategic level inventory management KPIs
At the top of the pyramid, we find the strategic KPIs associated with inventory management. These indicators are closely tied to the company’s overarching objectives concerning inventory and logistics. Here are some examples:
• Inventory turnover: As mentioned, this metric calculates how rapidly inventory sells within a specific timeframe. It offers insights into inventory management efficiency and product demand.
• Customer service level: This KPI evaluates the company’s capability to meet customer demand by ensuring adequate and timely inventory.
• Inventory cost: This indicator provides a comprehensive view of the total expenses incurred in holding inventory. It encompasses factors such as storage, obsolescence, and shrinkage.
Tactical level inventory management KPIs
At this level, we have KPIs that concentrate on specific aspects of inventory management. Managers and heads of logistics or the inventory departments can gain valuable information from these indicators. Here are a few examples:
• Forecast accuracy: This metric evaluates the company’s proficiency in predicting future demand and making necessary adjustments to inventory.
• Order Fulfilment Rate: This KPI assesses the percentage of orders that are delivered on time and in full.
Operational level inventory management KPIs
At the base of the pyramid, you’ll find the more intricate operational KPIs, closely tied to the day-to-day inventory management tasks. These indicators hold significance for the teams and employees directly involved in handling inventory. Here are a couple of examples:
• Inventory accuracy: This metric evaluates how accurately the physical inventory count aligns with the records in the system.
• Returns rate: This KPI measures the quantity of returned products and their impact on the inventory.
Supply chain KPIs takeaways
Supply chain KPIs play a vital role in monitoring and enhancing business performance. Nonetheless, it’s crucial to acknowledge that each company and industry is unique, resulting in the varying relevance and importance of individual KPIs. A KPI that is pertinent to one company at a specific moment may not hold the same relevance a year later.
The Necessity of Measurement: “What cannot be measured cannot be improved.” Effective inventory management relies on continuous measurement for improvement.
Definition of KPIs: KPIs are performance metrics that provide insights into business processes’ effectiveness and productivity, essentially outlining business objectives.
Role of Supply Chain KPIs: They evaluate the performance of the supply chain, aiding in effective decision-making, ensuring smooth material flow, guaranteeing product availability, and ensuring customer satisfaction.
Examples of Supply Chain KPIs: Some common KPIs include Perfect Order Rate, On-Time Delivery, Order Fulfilment Cycle Time, Lead Time, Supplier On-Time Delivery, Cash-to-Cash Cycle Time, Supply Chain Cost, Warehouse Utilisation, Backorder Rate, and Forecast Accuracy.
Inventory Management KPIs: These are metrics that focus on the control and management of inventory levels. Examples include Inventory Turnover Ratio, Turn/Earn Index, Gross Margin Return on Investment, and Days of Supply. These KPIs can be effectively monitored using advanced inventory management software to support better decision-making
KPI Pyramid: This is a hierarchical tool that measures and evaluates performance across different levels. Inventory management KPIs can be categorized into strategic, tactical, and operational levels.
The Changing Relevance of KPIs: It’s essential to understand that the importance of a KPI can change based on the company’s circumstances and industry context.
Recommendation: Ensure that while you have a set of established KPIs, periodically review them to ensure they remain relevant and reflect the current business goals and challenges.
Supply chain kpis FAQs
What are supply chain KPIs?
A key performance indicator (KPI) is a performance measure that involves a set of metrics. In the context of inventory management, supply chain KPIs measure how well we meet our objectives concerning supply chain management, helping businesses understand the efficiency, effectiveness, and productivity of their supply chain processes.
How do supply chain KPIs differ from inventory management KPIs?
Supply chain KPIs evaluate the overall performance of the entire supply chain. In contrast, inventory KPIs mainly focus on the management and control of inventory levels within a company. Examples of supply chain KPIs include Perfect Order Rate and On-Time Delivery, while inventory management KPIs might include Inventory Turnover Ratio and Days of Supply.
How should a company define and set meaningful supply chain KPIs?
KPIs should provide smooth materials flow throughout the supply chain, underpin effective decision-making throughout the end-to-end supply chain, guarantee product availability, and ensure customer satisfaction. The specific KPIs a company selects will depend on the industry, company objectives, and the nature of the supply chain.
What is the KPI pyramid in the context of inventory management?
The KPI pyramid serves as a management tool to measure and evaluate the performance across various hierarchical levels: strategic, tactical, or operational. In terms of inventory management, KPIs are categorized based on their placement within the pyramid. For instance, strategic level KPIs are closely tied to the company’s overarching objectives concerning inventory, while operational level KPIs focus on day-to-day inventory tasks.
Why is it essential to periodically review supply chain KPIs?
The importance and relevance of KPIs can change based on a company’s circumstances and industry shifts. What is pertinent to a company at a specific moment may not hold the same relevance later. Regularly reviewing these KPIs ensures they remain aligned with current business goals and challenges.