Table of contents
Table of contents- Lean Logistics: How to Eliminate Waste Throughout your Supply Chain
- What is Lean Logistics?
- The principles of Lean Logistics
- Which KPIs can be used to measure the success of Lean Logistics?
- Eliminating waste through Lean Logistics
- Controlling demand to meet customer needs
- What are the possible logistical flows?
- Lean Logistics: Reduce waste to be more competitive
- Authors
- Lean Logistics FAQs
Overview
Lean Logistics is a management approach focused on maximizing customer value by minimizing waste—such as time, resources and unnecessary movements—across the supply chain. Its core principles include eliminating waste (like excess inventory and lead times), focusing on customer value, continuous improvement (like Just-in-Time), and involving personnel. Key waste-elimination strategies involve accurate demand forecasting, optimizing procurement, managing purchase batches and addressing logistical constraints.
The continuous pursuit of efficient business processes is the maxim of all top-performing companies. Achieving operational excellence is more important than ever, especially in a changing – sometimes even hostile – environment with disruptions constantly affecting normal functioning.
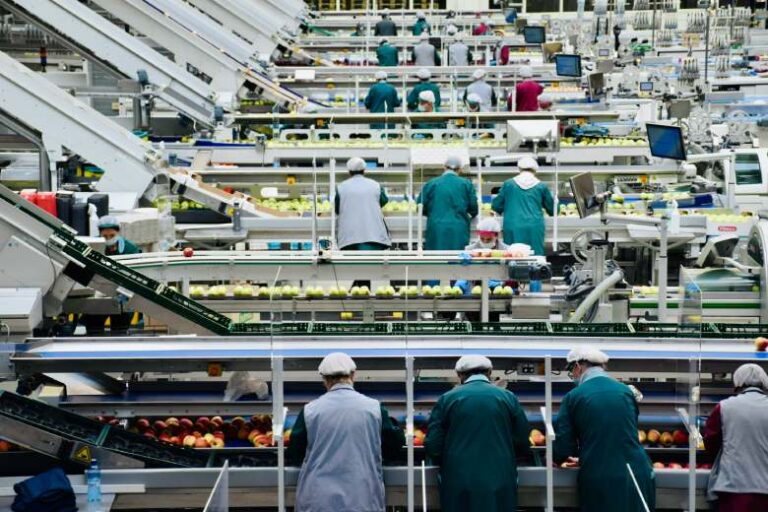
In this sense, Lean logistics is one of the most popular techniques in companies of all sectors. Stemming from the field of manufacturing, this management philosophy has transcended its origins and is now present in practically all industries.
The link between Lean methodology and the supply chain has become a key focus for many organisations seeking to improve material flow efficiency, optimise lead times, reduce waste, minimise costs and ultimately meet changing customer demands in a highly competitive environment. The integration of Lean Logistics principles implies a paradigm shift from traditional approaches to more agile and flexible systems aimed at eliminating non-value-adding activities while creating smoother and more efficient processes.
What is Lean Logistics?
Lean logistics is a business management approach that focuses on maximising customer value by minimising waste. It seeks to identify and eliminate activities that do not add value to the final product or service. Waste can be in the form of time, resources and/or unnecessary movements, amongst other things.
The principles of Lean Logistics
And how does the term ‘Lean’ apply to supply chain operations? Well, at this point, let’s review what the pillars of Lean Logistics are and how they contribute to eliminating waste and the company becoming more efficient.
- Elimination of waste: In logistics, the aim is to minimise customer lead times, excess inventory, unnecessary movements and any other aspect that does not add value to the flow of products. Storage, packaging, transport and distribution processes are optimised to reduce downtime and unnecessary costs.
- Focus on generating value for the customer: The aim is to understand which logistics activities are really valued by the customer. This involves the fast, accurate and reliable delivery of products. Lean logistics focuses on aligning processes to meet customer expectations and on minimising any activities that do not directly contribute to customer satisfaction.
- Continuous improvement: In logistics, this involves constantly reviewing processes to find ways to optimise the flow of products and services. Techniques such as Just-in-Time (just-in-time production/distribution) are implemented to reduce inventories, and data visualisation tool used to identify problems quickly and solve them efficiently.
- Involvement of people: This principle is applied in logistics by enabling and empowering workers to make informed decisions that improve efficiency and quality in the supply chain. Collaboration is encouraged and the contributions of those directly involved in logistics processes are valued.
Which KPIs can be used to measure the success of Lean Logistics?
The KPIs designed to measure the success of the implementation of Lean methodology in a company can vary according to the specific focus and objectives of each organisation. Below are some of the logistics indicators that can be improved with Lean methodology.
- Lead Time: The total time that elapses from the start of a process until it is completed, or from the time that goods are ordered until they are delivered. A reduction in lead time indicates greater process efficiency.
- Throughput: The amount of products or services that are completed in a specific period. It could apply to the number of orders that are delivered in a given time. An increase in throughput indicates an improvement in productivity.
- Stock Level: The amount of inventory in process or in storage. A decrease in inventory level may indicate more efficient management of resources.
- Waste Reduction: The amount of waste reduced in processes. It can be measured in terms of inventory reduction, lead time, etc.
- First-Time-Right/Error Rate: The proportion of products or services that are delivered correctly the first time. The number of first deliveries in logistics can be a practical example.
The choice of KPIs will depend on the company’s objectives and focus areas in its Lean implementation.
Eliminating waste through Lean Logistics
As going into detail on each of these pillars would make an exceptionally long article, in this post we will focus on the one we mentioned first: the elimination of waste. And in our company, we know all about eliminating unnecessary stock. To make progress on this point, 4 aspects must be considered: demand volatility, the level of supply, the purchasing batch size strategy and logistical constraints.

Controlling demand to meet customer needs
In order to eliminate waste, a key issue is to carry out good demand forecasting.
When we talk about demand forecasting, the first associated concept that comes to mind is the demand pattern. In fact, the mathematical model that we will use to calculate the demand forecast will depend to a large extent on this pattern.
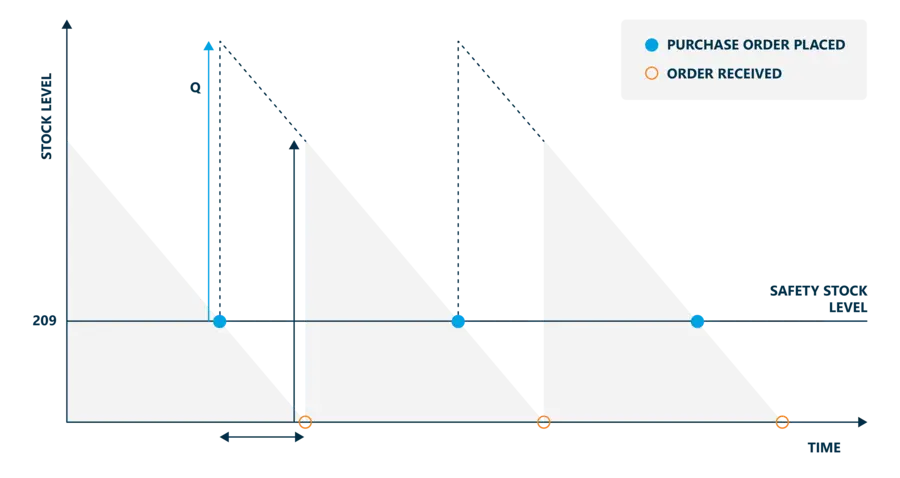
In an ideal world, controlling demand would be as simple as the saw-tooth graph below. The problem is that this practically never happens, and the references of our stock will follow different patterns: demand every month with a little or a lot of variability, with a few months of demand, with seasonality, with an upward or downward trend, with an irregular pattern … and each of these patterns will make one or another mathematical model more advisable.
In fact, a more or less stable behaviour – although in no case a straight line as shown in the above example – will occur in, at most, 10% of our assortment. We are talking about products whose periodic variability of demand is sufficiently small so that their instability does not affect stock management.
But what about the rest? They require active control of their supply points and this needs to be adapted to the reality of demand at any given moment. Something that seems so obvious as the fact that the level of supply of seasonal references cannot be the same throughout the year, is not always so obvious to some companies. Similarly, depending on the life cycle, the demand for a product is changing, and with it, its procurement needs and the way a product is procured must be adapted to the reality of its demand in order to get the maximum benefit from its operational management.
How to identify the pattern of demand
There are 3 fundamental concepts to bear in mind:
Frequency of demand
For this purpose, the last 12 months of clean demand, without noise, are used. Based on this frequency, we distinguish 3 subgroups of items: those with more periods with sales than without sales, those with more periods without sales than with sales, and new items.
Seasonality
To identify the seasonality of demand, 24 months of information is needed, and it is advisable to use Fisher’s test. Through this system it is possible to study whether there is an association between two qualitative variables, ie whether the proportions of one variable are different depending on the value of the other variable. Depending on the result of Fisher’s test – also known as F test – the probability of a relationship between the two variables studied increases or decreases.
With regard to the study of seasonality, by analysing the last 24 months we must establish the degree of relationship between the behaviour of demand and the time variable. In mathematical terms, if the result of the F test gives a value greater than 2.82, this means that the relationship between the two variables analysed is greater than 95%. Therefore, in our seasonality study, if the result of Fisher’s test is higher than 2.82, we can be sure that there is more than a 95% probability that the forecast also follows a seasonal pattern.
Trend
For the consideration of the trend we propose to use the linear regression model. The objective is to determine the relationship between a dependent variable and one or more independent variables.
This is key, especially when we are talking about mature products that are stocked against stock and whose demand starts to decrease. The faster we are able to detect the slowdown in demand and the faster we can stop stocking, the more we will reduce the risk of obsolescence of our stock, thus increasing its health.
By taking all these keys into consideration, we will increase forecast accuracy and adjust our stock as much as possible to the expectations of our customers, moving towards the elimination of waste without excesses or stock-outs.
Optimisation of the procurement level
The stocking level can be treated as the stock point at which an order should be placed. It is not enough to calculate it one day and not check it again until 12 months later, but, to be really effective, it must be updated almost on a daily basis.
We will now talk about key concepts when discussing the optimal stocking level of each reference. Period of coverage, safety stock, service level – we will see how each of these concepts affects the level of provisioning and how they relate to each other.
Period of coverage
The coverage period is key when it comes to procurement, ie when scheduling the purchase order planning to be carried out for a reference.
What does it include?
Specifically, two elements. The internal review time, which consists of how often, in an ideal scenario, you want to review whether or not a reference should be stocked, and the lead time, which is defined as the time that elapses from the time the order is placed until the goods are available in the system.
Therefore, one idea must be clear: two different suppliers for the same reference can mean two different coverage periods, and this will have a direct impact on the average stock we manage for that reference.
To understand it well, the coverage period of an Asian supplier will generally be longer than the coverage period of a local supplier, so generally sourcing from Asia means having to take on more stock in our warehouses.
In this case, in risk management phases (eg when a new benchmark is introduced in the market), we advise to do it as far as possible with a local provider who allows more agility, as this will result in a shorter hedging period.
And in order to keep it up to date, what criteria should we pay attention to?
We should pay attention to two parameters.
On the one hand, we must know what the expected demand is within that number of days for the next period to be covered. This value is completely dynamic. If we choose an item with a very stable demand, it is likely that we will not notice it so much. But imagine a seasonal item.
Depending on the time of the year, the forecast to be covered in that coverage period will be very different. Or imagine now an item with an upward trend. Each time we update the forecast to be covered in the next coverage period, the units to be covered will have increased.
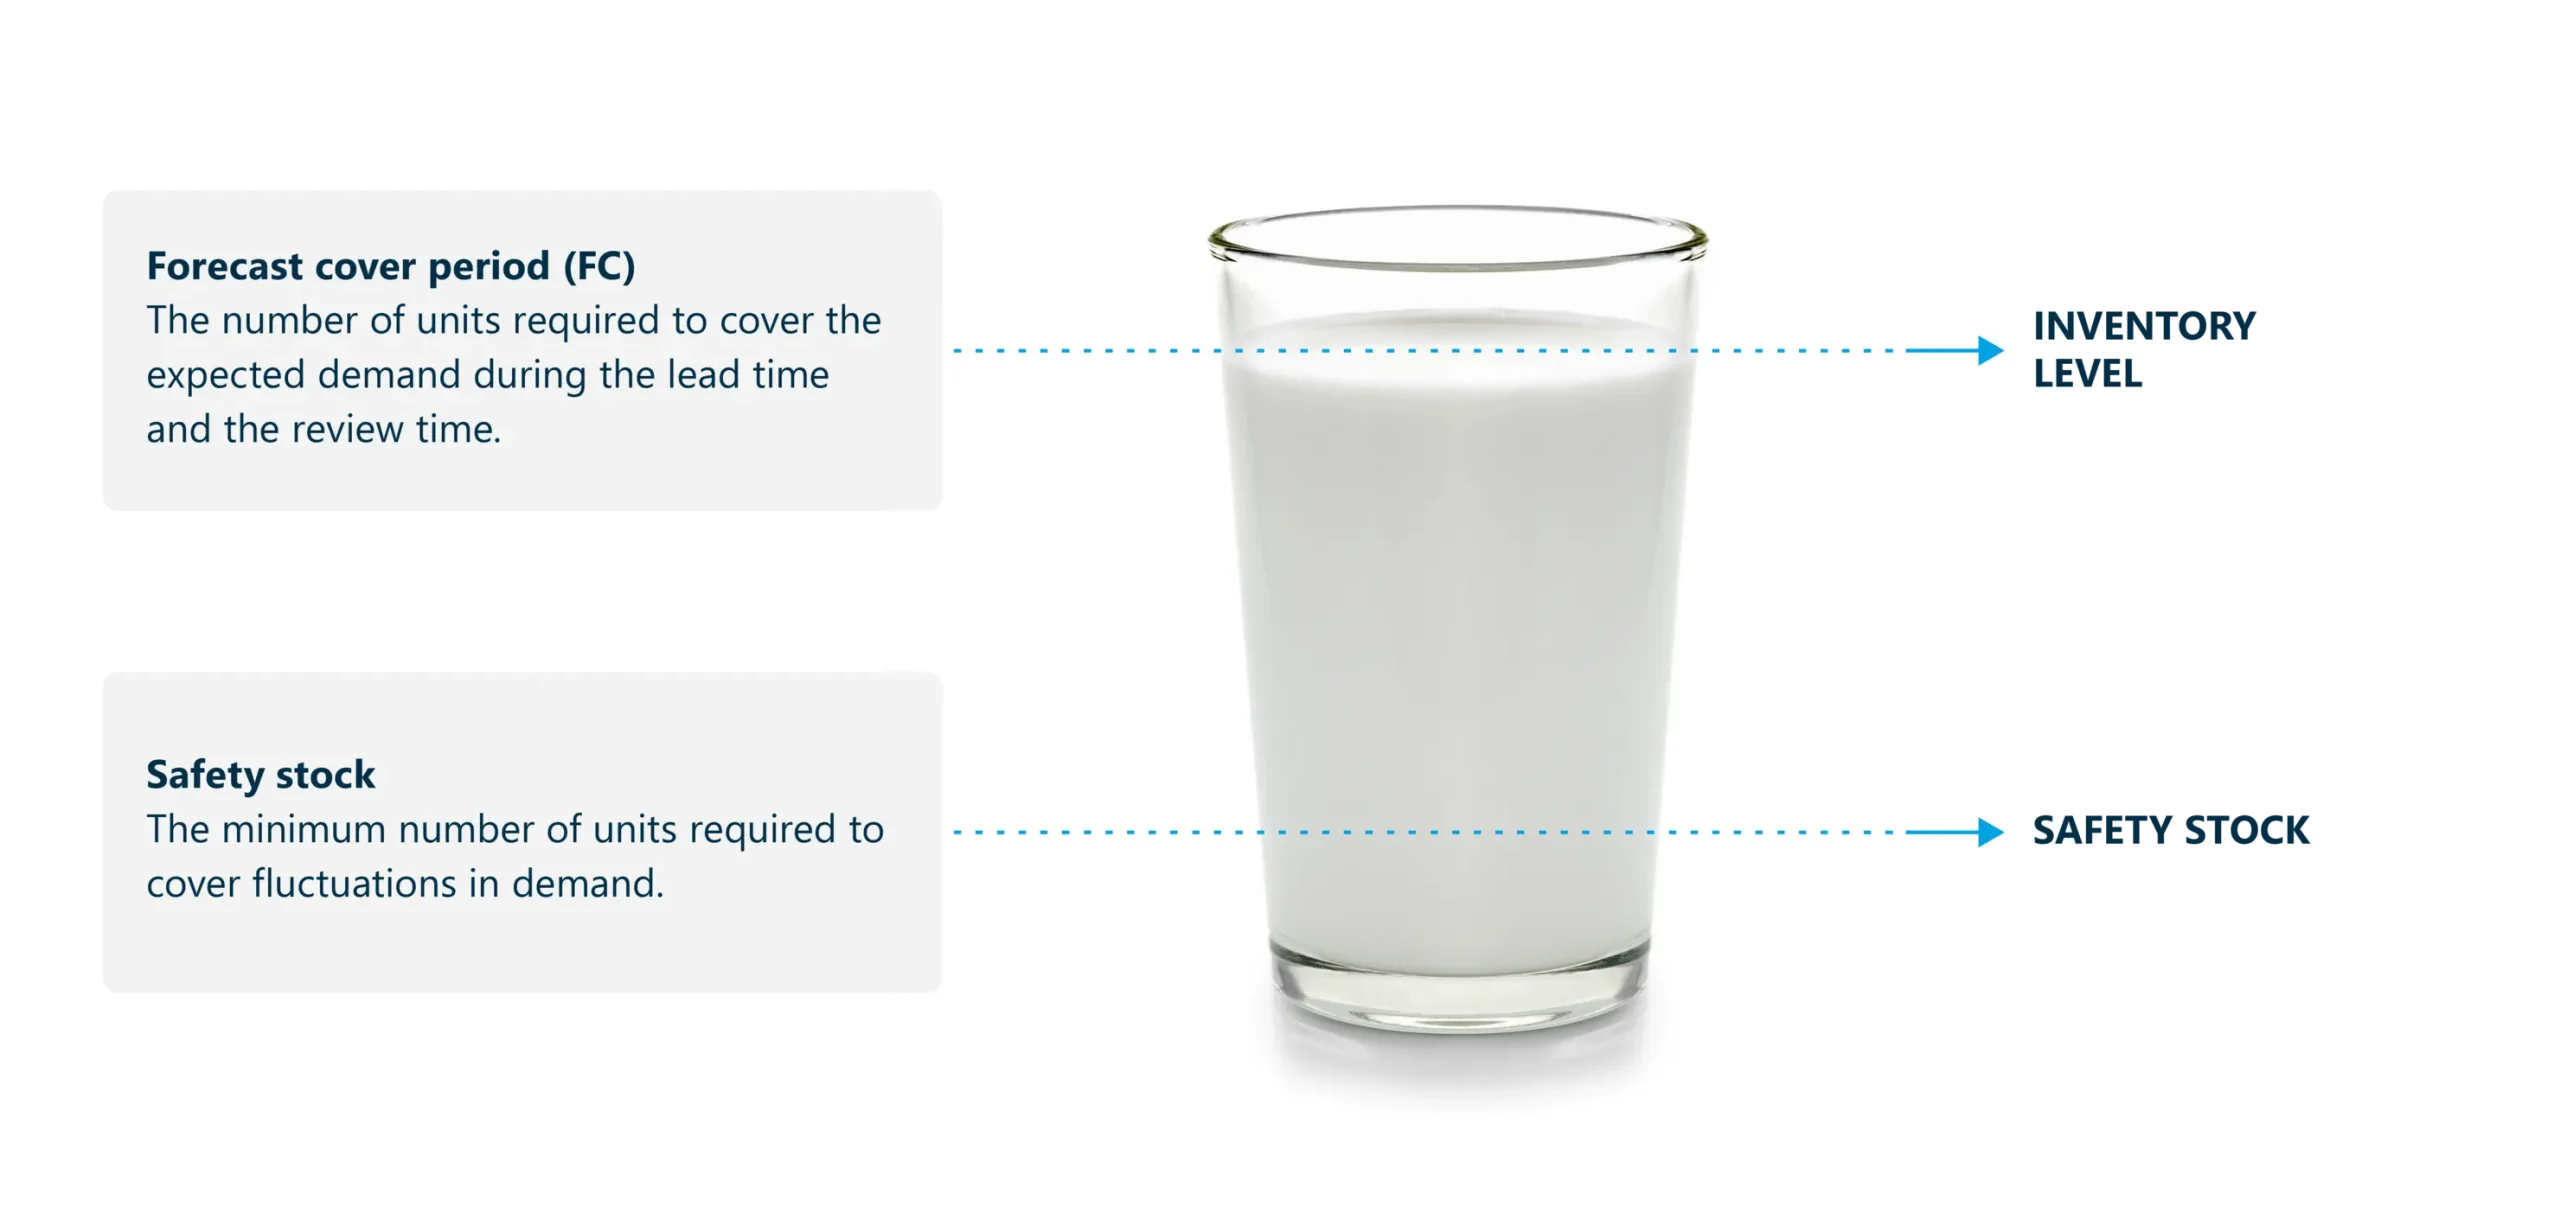
Safety stock
The second parameter is the safety stock. As with the forecast in the coverage period, it is again 100% dynamic. It is conditioned by the deviation of demand, lead time and the desired service level. Therefore, to get the full benefit of its application, it must also be kept up to date.
This means that, as you see in the image of the glass of milk below, the sum of the forecast in the coverage period and the safety stock gives us the level of supply of a reference at a given time.
Optimise purchase batches
Determining the optimal sourcing point of a reference is a big step towards eliminating waste and complying with Lean Logistics principles. But there is still a lot to do. Once we have this optimal sourcing point, we must also work on the purchasing/procurement strategy for our products. This is directly related to the different logistics flows that can be established in our supply chain.
Tips for optimising supplier purchasing and replenishment
Going into more detail, we can separate between purchases from suppliers (upstream) and replenishment from regulated centres or shops (downstream).
Upstream management: How to optimise purchasing from suppliers
- Establish order calendars. Playing with internal review times and adapting coverage periods for each supplier facilitates operations while optimising quantities.
- Establish permitted and prohibited flows. Choose a logistical flow model. There are 4 options that are the most common and we will see them below.
- Diversification of suppliers. It is advisable not to have only one possible supplier for the supply of each of our references. Similarly, the direct cost of the product should not be the only criterion for selecting a supplier, but we should also pay attention to the delivery time and the purchase batch.
- Evaluate suppliers. Analyse well the agreements we have with suppliers – minimum purchase quantities, euros per order, etc – and be aware of what it means for us every time we have to bring forward procurement needs to comply with these restrictions.
Downstream management: How do we replenish our shops and stocking locations?
- Optimise delivery schedules. As in upstream management, internal review times must be optimised and the coverage of replenishment orders must be analysed.
- Establish a matrix of transfers between regulated shops or centres. That is to say, between which points the transfer of merchandise is allowed and between which points it is not. And once this matrix has been defined, set up other types of rules to ensure that the transfers to be made are advantageous for the company.
- Order automation. When we focus on the pure replenishment of shops, what we recommend at Slimstock is that this operation should be as automatic as possible. Why? In-store items tend to have a slow demand pattern, so by carrying out a good in-store forecasting process, coupled with a dynamic and up-to-date policy of differentiation by service level, the replenishment process can be automated to a very high degree – always, of course, with alerts that stop the order if any anomalous behaviour is detected.
- Management rules in case of shortages. The steps to be taken in the event of a product shortage must be very clear: should the product be removed from the active range of certain shops or regulated stock points, or is it better to distribute the article evenly among all points? The strategy must be prepared to act when the case arises and the reason for the shortage must also be analysed in order to try and avoid it on subsequent occasions.
What are the possible logistical flows?
Every company is different and has its own nuances. However, the most common flows of goods in companies today can be reduced to four main models:
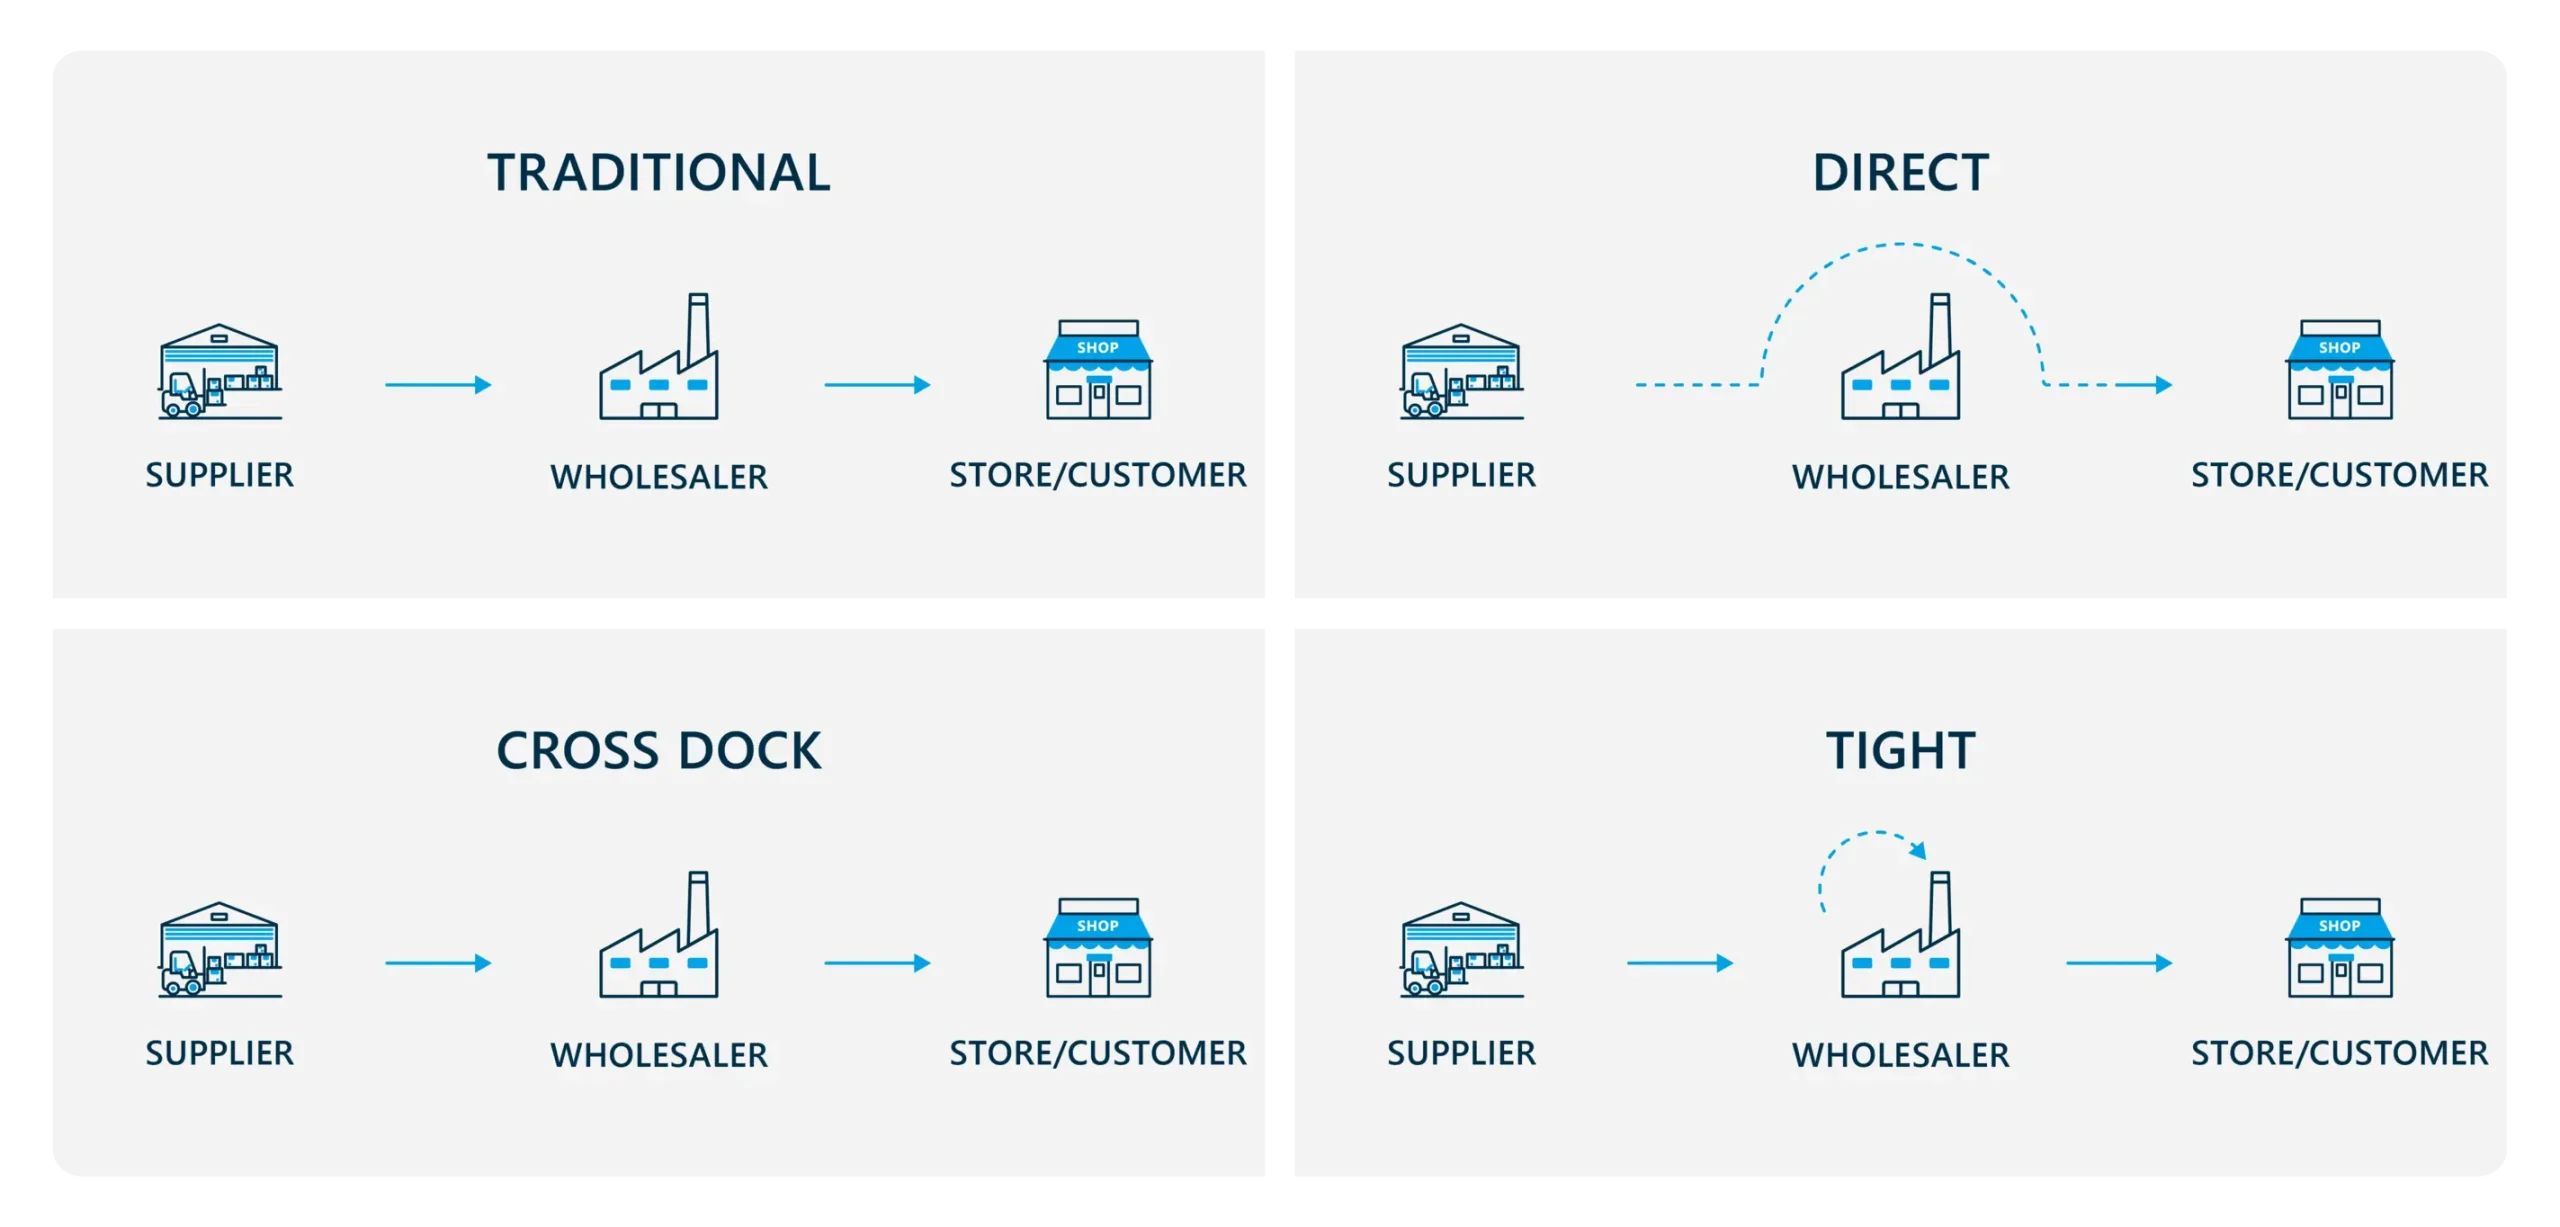
Traditional flow
Traditionally, the supplier delivers the product to the distribution centre, the goods are stored and orders are delivered to the shop or customer. Generally, companies opt for this flow because of the great flexibility it offers, both to meet specific variations in demand and to deliver small quantities to their network of shops or to customers.
Direct flow
In this case, the supplier delivers the goods directly to the store/regulated centre or customer without passing through the logistics centre. This type of flow is used when the need to be covered in the store/regulated centre or customer is sufficiently important to cover the logistical restriction imposed by the supplier on its own. For example, the order corresponds to a full van from the supplier.
Cross-dock flow
This is a flow that is becoming more and more common in companies. In this case, when the supplier delivers the goods to the logistics centre, the goods are not stored as in the case of the flow against stock. In addition, the goods do not pass through the incoming or receiving yard. Once the supplier delivers his goods, they are directly separated into the different store/regulated centre or customer orders to be delivered, so the goods are not placed in the storage positions. And the main difference with the flow against stock? In this case, the recipient of the goods assumes higher order quantities (boxes, pallet layers or pallet), so that the flexibility we talked about before is lost.
Tight Flow
Tight flow is widely used in retail chains and supermarkets and is a mix between flow against stock and cross-docking. These are goods that arrive at a destination at the moment they are going to be used. In other words, it is the product that enters a warehouse with the expectation that it will be dispatched the same day.
EOQ in procurement optimisation
When making purchases, we must adjust to the existing logistics units of our suppliers. It is very important to measure the impact of this adjustment to existing logistics units, as there are times when we can double or even triple the real need due to the adjustment. In these cases, it is necessary to identify and renegotiate with suppliers to increase the health of our inventories.
When it comes to optimising procurement, one concept stands out from the rest: EOQ.
EOQ stands for economic order quantity, and it is a technique used to determine the optimal quantity of an item to order at a given time in order to minimise the total cost of inventory.
And what factors should we take into account to optimise it?
Seasonality of the product in the EOQ
It is not the same thing to calculate the EOQ of a seasonal product when we are in the peak season as it would be when we are in the off-peak season. (No one should think of working with averages when we are talking about a seasonal item.) Therefore, the demand forecast for the product must incorporate the seasonal factor, and we must adjust the horizons with which we work.
To use more colloquial language, with a seasonal product, I cannot expect that on 1 January I will be able to calculate the optimal purchase batch until 31 December. With a seasonal item, the working horizons will have to be according to the seasonality of the product, so, for example, I could have an EOQ of the product from January to April, another from April to September, and another from October to December.
Promotions
All scheduled promotions must be taken into account and added to the demand forecast for the product as additional demand. Again, the fact of working with promotions that alter the demand for the product means that you cannot work with an annual demand horizon, but rather the dates on which these promotions are planned will also mark the demand forecast horizon that can be covered with each EOQ calculation.
Trends and product life cycle
It is not the same when a reference is growing, when it is in the maturity phase, or when it is in decline and near the end of its life. The behaviour of demand is not the same and, as you can see, you have to be very sensitive to any change in behaviour in order to correctly tune the EOQ.
Scheduled product recall
It seems obvious, but we occasionally come across cases where it is not so obvious. If you know you are going to withdraw a product in June, don’t take on the demand until the end of December.
Adequacy of logistics units
This can help us to take advantage of volume price discounts. We are not talking about one-off offers from the supplier, nor about volume discounts, but about volume discounts in our official tariffs. For example, up to 500 units the price is 1; from 500 to 1,000, the price is 0.98; and from 1,000 upwards, it is 0.96 per unit.
Application of the Economic Order Interval
The Economic Order Interval consists of optimising the procurement frequency of the selection of products, for example, by segmenting by supplier and by attribute. Therefore, we no longer only perform the optimisation per item (EOQ), but the optimisation is carried out with a selection of products to determine the optimal frequency for the set we have decided on.
Management of inter-site transfers
It is a topic that always comes up in conversations when we are getting to know a company. However, although there are many companies that make transfers between their different stock points, few actually benefit from these transfers. It is very common to have the feeling that there are boxes going back and forth from one centre to another with no clear sense of movement.
What is the purpose of making transfers between sites? The reasons may be many and are dependent on each individual company. But there is one reason that stands out amongst all the rest: to cover a product need in one centre with the excess of another.
Is there a way to avoid bad practice when managing transfers between centres? Yes, and here are two recommendations.
On the one hand, we must have a clear idea of the transfer matrix. For example, we have to represent in a matrix the sites between which transfers of goods are allowed and the sites between which they are not. In the example below, we have put a ‘1’ in the allowed combinations and an ‘N’ in the forbidden combinations. Once this matrix is defined, 50% of the work is done.
And what does the other 50% consist of? We must establish the rules that determine whether or not a transfer will finally be carried out in those combinations where it is allowed: restriction in units, restriction in euros, restriction that takes into account how long it takes to deliver the product from the head office and how long it takes to carry out the transfer between centres … These rules will allow us to apply a certain science when determining the transfers between centres.
Kave Home: Inventory optimisation equals waste reduction
One of the most paradigmatic cases of a company that has managed to reduce waste and become more efficient through stock optimisation is that of Kave Home. Due to its accelerated growth, the company, specialising in designer furniture, faced challenges such as product obsolescence and skyrocketing storage costs.
However, thanks to the implementation of Slim4, Kave Home has managed to reduce stock by 40% and import volume by 14%, and, as a result of this inventory reduction, has managed to cut its carbon footprint by 15%.
The alleged logistical constraints
The last of the blocks to be dealt with are logistical constraints … or rather, what we sometimes believe to be logistical constraints. Let’s see what the most common mistakes are.
Confusing lack of space with poor use of space
Sometimes a poorly organised warehouse is mistaken for a lack of space. To solve this, it is necessary to place the products in our warehouse according to certain criteria. And it is important to update these criteria regularly, otherwise the positive impact will not be felt.
The question is, on what basis do we order the products in our centres? Here are 3 possible criteria:
- Movement: place high-turnover items in the most accessible part of the warehouse.
- Profit: always have available the items that contribute the most to the profit margin.
- Risks: reduce the risk of obsolescence and take action before items become obsolete.
Trucks too full or too empty
The second point is the optimisation of transport. It is common to hear the phrase, “If the lorry is not full, I am paying to move air.” The phrase is not without credibility, but transporting goods we don’t need is just as disastrous as transporting air. What advice do we give when it comes to optimising the transport of goods?
- Freight vs ‘extra cost of possession’ cost. We often advance goods because we don’t want to pay for postage. This is fine, but when it comes to adding products to reach that minimum, we must take into account the cost of possession that this extra merchandise entails. You have to consider the hidden costs of stocking more goods than necessary.
- Analyse the coverage of the stock we advance. The coverage of the stock we are supplying must always be analysed. And, in order to know the coverage of the stock we are supplying or bringing forward, a good forecast of the demand is essential.
- Diversification of suppliers. Experience tells us that it is advisable to have different suppliers to supply the same reference. It is also important not to pay attention only to cost when deciding whether one supplier is better or worse than another. Aspects such as product quality, delivery time or purchase batches must also be taken into account in this evaluation.
Prioritisation when receiving goods
Something that your logistics team will be very grateful for is a daily or weekly template where the different supplier or issuing centre orders that are expected to be received are listed, sorted by days.
Most importantly, it is necessary to indicate the product lines they contain, and also the product lines with urgency. This is key, especially when we find ourselves on ‘incoming goods beaches’ with several simultaneous orders, and the logistics team does not know which one to start with.
Lean Logistics: Reduce waste to be more competitive
Throughout this article we have explained what the Lean Logistics methodology consists of, emphasising everything we can do to reduce material waste and process inefficiencies. We have focused on stock optimisation because it is one of the main sources of waste in all companies. At the end of the day, it’s about reducing waste to become more efficient.
We are not talking about reducing waste in just one sense of the word, but also about being efficient in other resources – capital and time, effort, and wear and tear on our teams – that our company invests in to carry out all of its activities. All of this with the aim of remaining competitive and resilient in an environment that today is marked by unpredictability, and with the only certainty that we can expect the unexpected.

Authors

Luis Rodriguez
Business Manager
Connect via LinkedIn

Manuel Yagüe
Business Manager
Connect via LinkedIn
Lean Logistics FAQs
How do waste reduction effors and Lean Logistics relate to each other?
Waste reduction and Lean Logistics are closely linked. Lean Logistics aims to eliminate waste in the supply chain by optimising processes and reducing lead times. Waste reduction contributes directly to this objective by minimising excess inventory, improving production efficiency and reducing storage and transportation costs. In both cases, the goal is to maximise value while minimising waste, leading to more efficient, sustainable and profitable operations.
What role does technology play in the implementation of Lean Logistics?
Technology acts as the backbone of Lean Logistics implementation by enabling real-time data collection and analysis. Specifically, inventory management systems, fleet tracking software and tools are some of the systems that help to meet the principles of this methodology. In short, any technology that helps to increase visibility throughout the supply chain.
What are the main challenges when implementing the Lean Logistics methodology in an organisation?
The implementation of Lean Logistics faces challenges such as cultural resistance to change, the need to restructure entrenched processes, and the need for training and staff commitment. Technology integration can be costly and complex. In addition, maintaining continuous improvement involves constant monitoring and adapting to fluctuations in demand or market conditions. Lack of visibility into the supply chain can also hinder optimisation. Overcoming these barriers requires strong leadership, effective communication and a continuous improvement mindset throughout the organisation.
What are the key strategies to reducing waste in an organisation’s supply chain?
Reducing waste in the supply chain requires work in several key areas: optimising inventory to avoid overages, improving demand planning and forecasting, and eliminating redundant processes. Working closely with suppliers and implementing Lean methodologies, fostering a culture of continuous improvement and training staff to identify and address waste are the key pillars.