Table of contents
Table of contents- From Data to Decisions: Harnessing Forecast Accuracy for Supply Chain Excellence
- What is forecast accuracy?
- How to measure forecast accuracy
- What does ‘good’ forecast accuracy look like?
- Which forecast accuracy model should you use?
- What should I use forecast accuracy for?
- Final thoughts on forecast accuracy
- Blog authors
- Forecast accuracy FAQs
Overview
Forecast accuracy is a vital supply chain metric that measures how closely predicted demand matches actual demand, helping to improve inventory management and business processes. Common measurement methods include Bias/ME, MAE, MAPE, and RMSE, each with different strengths and weaknesses, meaning no single model is universally ‘best’. Targets for ‘good’ accuracy are context-dependent and should be judged by comparing a model’s performance to that of a simple baseline model, as well as by using forecast accuracy to quantify demand uncertainty for safety stock planning.
Let’s kick off with a hard-hitting statistic: 77% of businesses are investing in technology to create better supply chain visibility. But here’s the intriguing part: those who’ve already taken the plunge were reportedly twice as likely as others to avoid supply chain problems.
Supply chain visibility is therefore a top priority for supply chain leaders. But, in an era where AI and machine-learning-powered tools are transforming the landscape of forecasting, there’s a crucial planning paradox we cannot afford to ignore, and that is that no forecast is immune from error.
Thankfully, there are statistical tools and techniques that can help you close the gap between projected and actual demand.
Hence, in today’s blog, we will delve into the topic of forecast accuracy and how you can use this powerful statistical analysis technique to build more robust forecasts and create better visibility throughout your entire supply chain.
Let’s start with the fundamentals.
What is forecast accuracy?
Forecast accuracy is a method you can use to judge the quality of your forecasts. In the context of supply chain planning, forecast accuracy refers to how closely the predicted demand for products or services matches the actual demand.
The result of this analysis can help ensure more effective decision-making. But make no mistake; it’s not a silver bullet you can utilise as a quick fix to cover your forecasting shortfalls.
Even establishing what margin of error to allow for can be troublesome. After all, how can you define what ‘accurate’ looks like?
100% accuracy would be a dream, but it’s often more of an idealised benchmark than a realistic outcome. Likewise, 75% sounds reasonable, but whether it’s achievable, or even useful as a target, is almost impossible to answer.
It completely depends on the goals of your company, the nature of your customers’ purchasing behaviour and the data you have at your disposal.
How to measure forecast accuracy
While forecasting your anticipated sales success is valuable, the true insight often lies in assessing the accuracy of that forecast. To achieve this, it’s essential to establish a way of assigning a performance score to it. Factors such as forecasting frequency can also influence the reliability of your predictions, making it crucial to adapt your approach based on the planning context. In many cases, this score provides a more meaningful perspective than the forecast alone.
The fundamentals of measuring forecast accuracy
Before we continue, it’s important to cover the basics.
All measures are based on the forecast error, e. This error is the difference between the forecast, f, ie the predicted demand, and the actual demand, d, within a certain time period:
![]()
A forecast is good when the error measure is small.
Sometimes, however, the performance is focused on accuracy rather than the degree of error. In this case, a forecast is good when the accuracy is close to 100%.
There are several methods to assess forecast accuracy. And each one has positives and negatives attached. Below is a guide to the most common ones at your disposal.
Bias or mean error (ME)
The first forecast accuracy measure, called the bias or mean error (ME), is the average of the forecasting error:
![]()
This measure is easy to understand. For a good forecast, the difference between the predictions and the actual demand is small, so its bias is close to zero.
A positive bias indicates that you’re predicting too much demand, whereas a negative bias means that you’re underestimating it.
A drawback of this model, however, is that positive and negative errors cancel each other out. A forecast with large errors can still have a small bias.
Therefore, you should never consider the bias alone, but also look at other measures for forecast accuracy.
Mean absolute error (MAE)
A model that’s a direct indication of the magnitude of errors is the mean absolute error (MAE):
![]()
The advantage of this model is that it uses absolute forecasting errors, so a small MAE means that all forecasting errors are close to zero.
It’s also an easy measure to interpret.
However, it doesn’t show how large this average error is, compared to the actual demand. A forecast that’s off by 5 pieces is very bad for a product that sells 10 on average, but good for a product that achieves an average of 1,000 sales.
Mean absolute percentage error (MAPE)
The mean absolute percentage error (MAPE) reflects how large the errors are compared to the actual demand.
It’s defined as the average ratio between the forecast error and the actual demand:
![]()
Because of this, it’s also easy to interpret.
The MAPE indicates how far the forecast is off on average, as a percentage.
However, this forecast accuracy method also has its limitations. Overestimating demand is punished more than underestimations. Predicting 30 pieces when the actual demand was only 10 pieces gives a MAPE of 200%, but underestimations give a maximum MAPE of only 100%.
This is an issue for products with little demand, where it’s more difficult to obtain a small MAPE. But it’s an even bigger problem for time periods with no demand, as you’d be dividing by zero.
Root mean squared error (RMSE)
The final forecast accuracy model to mention is the root mean squared error (RSME).
As the name suggests, this measure is based on the square root of the forecasting errors:
![]()
This model is similar to, and therefore comparable with, the MAE, but punishes larger errors much more than smaller ones.
It’s a good measure to see if the forecasted and actual sales are always close to each other. Unfortunately though, this makes this particular model more difficult to interpret.
If your demand data contains an occasional outlying sale, which you don’t expect a forecast to capture, you should use the MAE method instead, as it is much more robust to outliers.
The mean squared error (MSE) is almost the same as the RMSE, but it doesn’t use the additional square root. Therefore, it expresses the error in squared units, making the MSE more difficult to interpret.
There are many other forecast accuracy measures available. Which one you should use will depend on the data you have at your disposal, and it may be worth checking out some of the rarer alternatives to see if there’s a better fit.
What does ‘good’ forecast accuracy look like?
The sheer amount of forecast accuracy models throws up questions like, “Which forecast accuracy measure should I use?”, and, “What should my forecast accuracy target be?”
Unfortunately, neither of these are easy to answer.
Let’s say you manage the forecast for your products and find out that, on average, the MAE is 60%.
Is that a good or a bad score?
A forecast accuracy score by itself doesn’t amount to much. The future demand for a product is To assess the quality of a forecast, you need an idea of how predictable the demand is. And that depends on many factors.
The demand for products with large volumes is usually easier to predict than slow movers. It’s also easier to predict the demand for a product in a group of stores than to accurately capture the demand in each store separately.
Furthermore, long-term predictions are much harder than forecasting short-term demand. The attainable forecast accuracy also depends on the amount of relevant data you have available.
If important information is missing, your forecasting models won’t perform well. After all, you can only make predictions based on what you know.

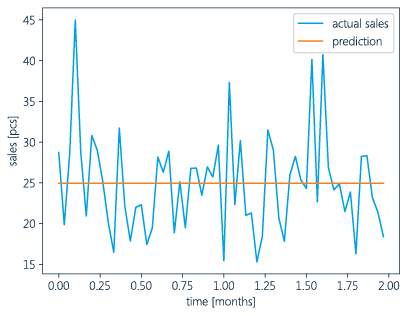
The two graphs above show a simple forecast and the actual sales of two hypothetical products.
The demand for the first product shows a distinct monthly pattern, so a constant forecast is clearly suboptimal.
For the second product, the same data has been used, but the demand is shuffled over time. This means that there’s no longer a monthly pattern in the data.
Without any additional information, a constant forecast is the best we can do.
All of the previously discussed measures show that the performance of this constant forecast for these two products is exactly the same. Of course, that’s misleading.
If you use a model that can detect weekly and monthly patterns, you will obtain a much better forecast for the first product, as the graph below demonstrates.

Graph 3: Good predictions of predictable demand
The above graphs all show one of the main drawbacks in trying to measure forecast accuracy, this being that you can only say the accuracy is good when it is put in the right context.
It’s much better to compare a model’s forecasting performance with other models than focusing on the values of the scores.
This is where baseline models come in.
A baseline model provides a forecast based on simple logic. It can calculate a constant forecast based on your average historic demand.
It can give you a lower bound on your performance with which to compare your forecasts, along with an idea of how predictable the demand is.
Comparing the forecast accuracy of our forecasting models to those of baseline models tells us how much better we are doing.
Which forecast accuracy model should you use?
As we have already mentioned, there are pitfalls and positives to every model that you can use for forecast accuracy. So, here’s a brief overview of them.
Table 1: Advantages and drawbacks of the forecast accuracy measures.
| Easy to interpret | Indicates over or under estimation | Small when the errors are small | Relative error | Sensitive to large errors | |
|---|---|---|---|---|---|
| Bias/ME | ✅ | ✅ | ❌ | ❌ | ❌ |
| MAE | ✅ | ❌ | ✅ | ❌ | ❌ |
| MAPE | ✅ | ❌ | ✅ | ✅ | ❌ |
| RMSE | ❌ | ❌ | ✅ | ❌ | ❌ |
It’s crucial to realise that each forecast accuracy model measures something different. Therefore, the best forecast will differ depending on your choice of model.
The graph below shows this more succinctly. Even for a constant prediction, different forecast accuracy measures do not agree on what the optimal forecast is.
So which forecast measure is best for you? Well, it depends on what you’re interested in.

Graph 4: For different forecast accuracy measures, different predictions are optimal
What should I use forecast accuracy for?
You should avoid looking at just one forecast accuracy model.
This way, it’s more likely you’ll avoid some of the pitfalls when forecasting accuracies of different products and product groups. Forecast accuracies, when used effectively, are however incredibly valuable to your business.
1) They can improve your business processes
If done properly, evaluating forecasting quality can be very useful for improving your business processes.
To find areas for improvement, you need to look at the impact of the forecasts on your inventory and your business as a whole.
This is where Business Intelligence (BI) holds the key.
Firstly, look at all the available data. Using BI, your data can be analysed and turned into actionable insights with the help of data visualisation tools.
You can then assess a range of performance indicators at the same time, and zoom in on very specific groups of products.
Furthermore, where your forecasts are less relevant, BI can reveal other areas for improvement in your business processes.
For products with short lead times and large batch sizes, it is not so relevant as to how accurate a forecast is. You reorder when stock is low and just wait however long it takes to sell these items.
The goal of BI is to obtain actionable insights from data, so that you can use it in data-driven decision-making.
Reporting on forecast accuracy at item level might not provide actionable insights. Good forecast exceptions, however, do generate actionable insights at item level and are triggers to immediately evaluate the forecast of specific items.
There is another reason why monitoring forecast accuracy is essential.
2) You can measure for uncertainty
A high-quality forecast is able to predict patterns in your demand data. But a forecast is never perfect. There will always be uncertainty about your future demand.
For good supply chain planning, it’s essential to know how uncertain your demand forecasts are. Then you can take uncertainties into account and consider the risk of stockouts.
If you want to ensure a certain level of service to your customers – and who doesn’t? – you need to hold safety stock to cover for uncertainties.
The less accurate the forecast, the more safety stock you’ll need.
Look at the differences between predicted and actual demand, ie the forecast error, for the two hypothetical products below.
If we assume we’ve been able to formulate good forecasting models for these products, ie they capture the predictable part of the demand, the forecast accuracy gives us information on the expected differences between the demand forecast and the actual demand.

Graph 5: For different forecast accuracy measures, different predictions are optimal

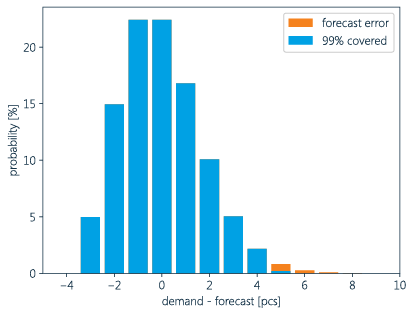
Group 6: Error distribution for a product with low expected uncertainty with the cover time
The above shows the error distributions for these two forecasts.
The product with higher expected uncertainty requires more safety stock for covering, for instance, 99% of the demand.
The graph also shows a symmetric error distribution.
This may be the case for good forecasts of products with high demand. But for products with low or irregular demand, the error distribution is not symmetric, because the demand cannot be negative.
To decide on an appropriate safety stock level, you need to take into account the shape of the error distribution.
By monitoring the distribution of forecast errors, you can get a good idea of the types of error to expect in the future and adjust your supply chain process accordingly.
Graph 7: Symmetric forecast error for a fast-moving product
Graph 8: Asymmetric forecast error for a product with low or irregular demand
Final thoughts on forecast accuracy
For supply chain planning, it’s absolutely essential to have a good idea of future demand and its volatility.
Therefore, it’s only natural to monitor forecast accuracy.
When looking into your own forecast accuracy, keep the following points in mind:
- It’s not possible to set general forecast accuracy targets, because you won’t know in advance how predictable the demand is (with the available data).
- Instead, you need to compare the performance of forecasting models to that of other (baseline) models.
- Equally, there’s no ‘best’ forecast accuracy model.
- For a good evaluation of the forecasting performance, you need to look at a selection of measures that relate to your goal.
- When assessing forecasting performance, you need to make sure you’re looking at all the relevant information.
- You should also focus on other areas in the supply chain process, especially when these are the performance bottlenecks.
- Good forecasts can predict patterns in your demand, but there will always be some uncertainty involved. Because, well, it’s the future and it hasn’t actually happened yet.
- Forecast accuracy is a way of measuring this uncertainty when relying on forecast predictions.
- You should use this information to adjust your replenishment processes and cover for any expected forecasting errors.
Looking to put these forecasting principles into action?
Discover how you increase supply chain effectiveness, manage inventory levels, and improve forecast accuracy with Slimstock’s advanced demand forecasting system.
Blog authors

Nico Van Dijk

Kevin Overbeek
Forecast accuracy FAQs
What is forecast accuracy?
Forecast accuracy is a method used to assess the quality of forecasts. In supply chain planning, it measures how closely predicted demand matches actual demand.
How can I measure forecast accuracy?
Forecast accuracy can be measured using various methods, including Bias or mean error (ME), Mean absolute error (MAE), Mean absolute percentage error (MAPE), Root mean squared error (RMSE), and more. Each method has its advantages and drawbacks.
What is the significance of forecast accuracy?
Forecast accuracy is crucial for improving business processes and inventory management. It helps in evaluating the impact of forecasts on inventory, identifying areas for improvement, and making data-driven decisions.
What should 'good' forecast accuracy look like?
The definition of ‘good’ forecast accuracy varies depending on factors such as product demand patterns, lead times, and data availability. It’s essential to compare forecast accuracy to baseline models and consider the context.
Why monitor forecast accuracy?
Monitoring forecast accuracy helps in understanding demand uncertainty, determining safety stock levels, and ensuring a certain level of service to customers. It allows businesses to adapt their supply chain processes to account for forecast errors.


