
Table of contents
Table of contents- Embrace Business Intelligence for better supply chain decision-making
- The Business Intelligence Pyramid
- Benefits of Business Intelligence
- What do we need to get started with Business Intelligence?
- Business Intelligence in the supply chain
- Business strategies in the supply chain
- Which supply chain KPIs are relevant to our business intelligence?
- Recommendations for a good Business Intelligence process
- Business Intelligence FAQs
Overview
Business Intelligence (BI) transforms data into actionable insights for better supply chain decisions, following a pyramid structure of data, information and knowledge. BI enables informed strategy, faster reporting, trend identification, requiring strong data governance and the alignment of KPIs (e.g., stock turnover or service level) with defined business strategies.
“Business intelligence” was first coined by Richard Millar Devens in his Cyclopædia of Commercial and Business Anecdotes in 1865. Devens used it to describe how Sir Henry Furnese, a banker, turned a profit by acting swiftly on market insights ahead of his rivals.
With a team of business intelligence specialists throughout Holland, Flanders, France, and Germany, Furnese stayed in the loop about the battles during the Nine Years’ War. This gave him the edge, as he was the first to know about significant events such as the fall of Namur. Armed with this exclusive intel, he played the London stock exchange like a pro, leaving his rivals trailing and pocketing hefty profits.
Both in the distant 19th century and today, it is essential to be able to use all the data available to benefit our business.
When discussing Business Intelligence, we don’t mean Excel, SQL, Power BI, Tableau or Python.
Business Intelligence is not a tool but rather your ability to detect patterns in data and make decisions once you have transformed them into actionable insights.
The Business Intelligence Pyramid
We can describe the BI process using the BI pyramid. Data is the pyramid’s base, so data management is critical.
Data analysis starts with management strategy: What will the data’s role be? Who will analyse it? Who is responsible for data ownership?
It should be noted that data analysts spend about 75% of their time processing data before it can be used for analysis.
The data then needs to be transformed into information. For example, we can analyse the data for a category of items to determine the optimal stock level.
This data is transformed into information that provides us with knowledge. Once we understand the behaviour of a customer, a supplier, or a group of products, we can take action to drive performance improvements.
For example, if a particular supplier’s delivery lead times vary significantly, we could find an alternative supplier.
So, we can define BI as the data collection and analysis process and the subsequent processes that lead to performance improvement.

Benefits of Business Intelligence
Business Intelligence has many benefits:
Attain a holistic view
Through Business Intelligence, we can quickly create many reports. These reports allow us to analyse all the data in real-time, identifying possible problems in our company and detecting trends and patterns related to the business.

Inform strategic decisions
Business Intelligence enables informed strategic decisions backed by data. It facilitates the visualisation of insights to improve our understanding of information and, therefore, better decision-making.
Fast and accurate reporting
According to BI-Survey, 64% of companies say business intelligence helps them generate reports and analyse data more agilely. By embracing business intelligence, companies can visualise data in charts, tables, and graphs in real time, allowing them to act more quickly.
Identifying trends and patterns
One significant benefit of Business Intelligence is the ability to make data-driven decisions. This is because it provides tools to detect trends and patterns. Thus, it allows organisations to understand better their business and the environment in which they operate.
Methodology for generating business intelligence
We now move on to explore the methodologies for generating Business Intelligence. Here, we’ll walk through the various phases of the process to achieve this goal.
Data extraction, transformation and loading
This step combines data warehousing and ETL processes: Extract, Transform and Load. That is the process of collecting, cleaning and transforming data from multiple sources into a format suitable for analysis.
Data storage
We create a centralised repository where business data is stored for access and analysis.
Data analysis
At this point, we proceed with the analysis, and we can now use techniques and tools such as Python, Power BI, or others to explore, visualise and extract knowledge from the data.
Creation of reports and dashboards
We provide a visual presentation of data and key performance indicators (KPIs) to facilitate business performance monitoring.
What do we need to get started with Business Intelligence?
So, what do we need to start our BI journey? Well, we need to translate data into information.
We will use techniques and tools to explore, visualise, and extract knowledge from the data. In other words, we will use the complete BI pyramid.
We will use the ETL process and create the reports using graphical tools such as Tableau and Power BI. This will create a report that tells a story and allows us to visualise data and KPIs to facilitate business performance monitoring.
From there, we will make knowledge-based operational, tactical and strategic decisions.
However, to succeed, this whole process must be underpinned by robust data governance.
Data management to generate Business Intelligence
You may have heard the phrase Garbage in, garbage out. This simply means that if you put rubbish into the process, you will get rubbish out.
There are three elements to consider when carrying out data management.
Data awareness is necessary. That is, we must define the role of data in our operations, who will carry out the plans, who is responsible for the data, and who is the owner.
This implies that data must be accurate, complete, reliable and consistent. It also means working on data availability, managing data definition and data security. Data is of great value and must be secure.
Data and KPIs must be consistent across the organisation. If we do not have clear and unified information, the different parts of the company will discuss various concepts and units of measurement, and everything will be a big mess.
Data governance is the combination of strategies, people and processes that have to be aligned towards a common goal: data quality.
The responsibility for this lies with management and employees. In general, it is very simple: Does an employee generate data? They must, therefore, also own that data.
Business Intelligence in the supply chain
Now, let’s discuss the relationship between Business Intelligence and the supply chain in more detail. Let’s start by asking ourselves why we need BI in the supply chain.
Firstly, the supply chain plays a central role in all organisations, and supply chain management is difficult. Inventory management is also very complex. It involves a set of interconnected actors, such as suppliers, our internal teams, and our customers.
That is why it must be a strategic priority. If the supply chain does not have this relevance, we will reduce our company’s efficiency. This is why it is important to share supply chain information. Hence, the importance of the BI process in supply chain and inventory management.
Aspects of measuring supply chain performance with Business Intelligence
Setting targets for KPIs related to the supply chain and inventory in advance is essential.
For this, it is essential to know how the KPIs are defined. KPIs in inventory planning cannot be isolated. Inventory planning consists mainly of 3 interconnected aspects:
- The level of service provided to the customer.
- Inventory requirements.
- The capacity constraints of people and resources.
These three aspects are always connected, and it is essential to monitor all three indicators simultaneously. If you only focus on one area, you will inevitably get sub-optimisation in one of the others.
For example, stopping ordering is sufficient if the objective is to reduce stock and increase the turnover rate. However, if you do not measure the service level, which dictates the stock requirement, you may achieve one objective but miss out on your other critical goals.
Another example is that if the objective is to improve service, we could achieve this by investing in stock, but then the stock level skyrockets.
Everything is interconnected, and a balance must be found.
We must discuss basic business strategies to understand this correlation between business objectives better.
Business strategies in the supply chain
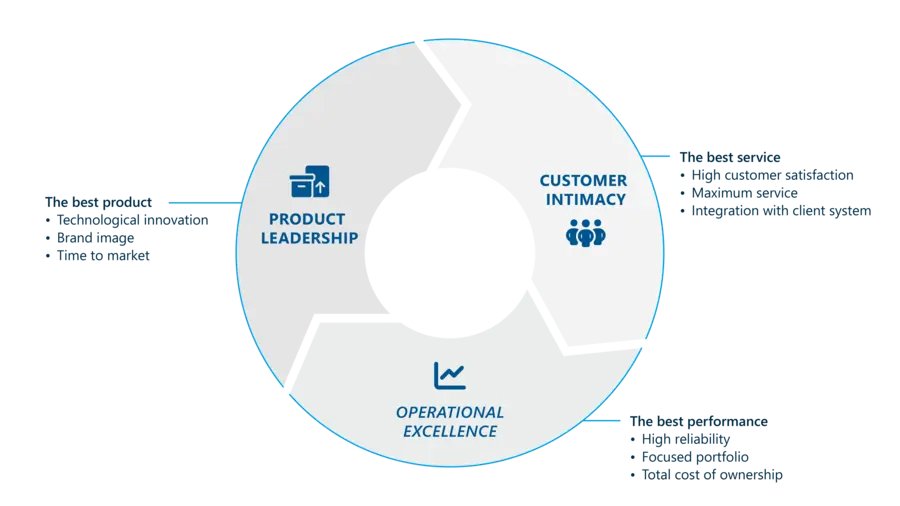
Product leadership
To achieve leadership in this area, you must try to have the best product through:
• A major technological innovation.
• A superior brand image.
• Better time to market than the competition.
If our strategy is one of product leadership, we must have a fast and agile supply chain in which the product range is constantly changing and where we have to keep an eye on the products that are left over. The main element to watch out for will be overstock.
Service Leadership
The second possible business strategy is to be able to give the best level of service. That is, customer intimacy:
• This implies high customer satisfaction.
• To provide maximum service with the necessary stock and even integrate it with the customer’s systems.
To lead in service, we must have a reliable and agile chain in which the product range caters to different customer needs. Therefore, we need to monitor stock outflows and how we serve the customer. In these cases, the service level is the leading indicator for tracking the supply chain.
Cost Leadership and Operational Excellence
The third strategy is operational excellence. That is, being able to operate at the lowest possible cost. To achieve this, we need the following:
• A high degree of reliability
• A focused portfolio
• Focus on the Total Cost of Ownership
Finally, if our strategy is one of cost leadership—i.e. operational excellence—we must have an adequate supply chain where the product range is efficient and focused and where we will have to monitor turnover levels.
To give an example of each of these strategies, we can think of Apple as product leadership, El Corte Inglés as service leadership and some discount retail chains as cost leadership, with very little choice for each product type and very controlled costs.
It is important to define a clear strategy because without one, you will not know where to focus.
Which supply chain KPIs are relevant to our business intelligence?
Let’s see which supply chain KPIs we should measure with our Business Intelligence process.
If we want to measure the overall performance of the supply chain and think of more common and understandable indicators for the whole organisation, we should focus on the following:
- Availability
- Days in stock
- Stock Turnover
- Stock value
- Service level
- overstock
- Out-of-stocks.
As mentioned earlier, never look at just one KPI. You must look at several so supply chain management does not become unbalanced.
The second element to control is the forecast. To prevent it, we will use forecast accuracy, analyse patterns at a grouped level by segment or product category, and manage promotions or special events.
The third element would be purchasing management, where we monitor the deviation between order advice and orders placed, breakage alerts and overstocks, and the number of open orders and their fulfilment rate.
It is also essential to monitor supplier performance. For this, we monitor the OTIF (On time in whole or orders that are delivered on time and in total) and the CVP (Percentage of confirmed volume), which is a lesser-known and less demanding measurement that calculates the goodness of the supplier as a percentage of fulfilment. For example, if we order 100 boxes and the supplier delivers 90 boxes, this will be a 0 for the OTIF measurement but a 90% for the CVP measurement).
With this data, we can draw up a ranking of suppliers.
To make a good analysis, we have to structure the reports to see the KPIs by relevant dimensions (either by categories, warehouses, planners, etc.). You must also choose the KPIs you want to focus on and define the related actions to improve them.
Recommendations for a good Business Intelligence process
Let’s start with the five critical steps to creating an effective business intelligence process.
1) Accelerate the adoption of Business Intelligence with SMART objectives
The organisation’s objectives must be SMART: specific, measurable, achievable, realistic, and time-bound. An example of a SMART objective could be: “We want at least 80% of managers to make decisions through BI in the next 12 months.” This is specific, measurable, achievable, realistic, and with a clear timeframe.
2) Analyse the critical components for adopting business intelligence
We must consider the critical elements of the company: people, processes and technological tools.
When considering people, we must create ownership and accountability with clear project sponsors and leaders. In addition, teams must have the necessary technical skills and training.
We can think about data management processes, data governance and possibly change management.
Finally, we need to select which tools to use, such as Power BI, Tableau, Python, or others.
3) Steer clear of the reporting jungle
We must avoid creating a jungle of reports. Otherwise, it will become impossible to ‘see the wood for the trees’—or rather, we may simply become paralysed by overanalysis.
We do not have to create a new report for every need; we can reuse existing ones. It is essential to define the purpose of a report well before starting to develop it.
You have to be careful with the details and set KISS targets. In other words, Keep It Simple and Stupid… Let’s try to keep everything as simple as possible.
When considering whether or not to create a new report, ask yourself: is it essential? If not, don’t do it.
4) Consider different information requirements.
We have to consider different information needs. Each part of the business needs information at a different level.
We can provide several levels of detail in each report so that each department has the information it needs quickly. What the company director is looking for is not the same as what the supply chain controller or the person managing the forecasting or procurement process is looking for.
5) Avoid the common BI pitfalls.
Finally, it is essential to avoid inevitable common mistakes.
The first is the need for more accountability for data quality. To tackle this problem, establish a clear RACI matrix.
The second is the need for data definitions. As a corrective action, we would edit a complete list of definitions.
The third mistake would be to have low data quality. To correct this problem, we need to create awareness and data governance.
The fourth mistake is that only some people share the value that data should have. We would tackle this problem with communication and training, as well as communicating the benefits of BI and the impact of insufficient data across the organisation.

Business Intelligence FAQs
How can business intelligence be applied to the supply chain?
Business Intelligence (BI) is applied to the supply chain by collecting and analysing data to make informed decisions. By integrating BI tools, processes are optimised, key KPIs such as inventory and lead times are monitored, and patterns are identified to forecast demand, among other issues. Data visualisation makes it easier to understand trends, improving planning and operational efficiency.
What are the main KPIs in the supply chain that can be measured through BI?
Business Intelligence can measure supply chain KPIs such as inventory turnover, cycle time, forecast accuracy, and customer service level.
How can BI contribute to inventory optimisation?
BI can contribute to inventory optimisation by analysing data to forecast demand, enabling more accurate planning and avoiding overages or breakages. Real-time monitoring of KPIs also facilitates dynamic adjustments, and BI-driven collaboration with suppliers improves joint inventory management. By analysing lead times, BI also optimises planning and minimises shortage risks.
What is supply chain intelligence?
Supply chain intelligence (SCI) refers to the application of business intelligence (BI) technologies and tools in supply chain management. It involves collecting, analysing, and using data to make informed decisions and optimise processes throughout the supply chain. SCI focuses on visibility, collaboration, and strategic decision-making, using data analytics to improve efficiency, reduce costs, mitigate risk, and improve customer satisfaction.