
Table of contents
Table of contents- Supply Chain Analytics: what it is, types of analysis and how to apply it
- What is Supply Chain Analytics?
- Supply Chain Analytics: what types of analysis can we carry out?
- The foundation of Supply Chain Analytics: clean and reliable data
- Conclusion: Good data is essential for Supply Chain Analytics
Overview
Supply chains generate vast amounts of data, but its real value lies in how effectively it is analysed and used. In this article, we explore what Supply Chain Analytics is, the four main types of analysis, and why clean, reliable data is essential for turning information into better decisions, greater efficiency and a more resilient supply chain.
In the age of information and digitalisation, organisations have access to an enormous amount of data. Every area and department within a business generates data, to a greater or lesser extent, as a result of its day-to-day activities. This data represents a valuable resource that companies can use to their advantage, although it is not always easy to manage.
In this article, we will focus on the information generated throughout the supply chain and the opportunities that arise from its effective processing and analysis. This is what is known as Supply Chain Analytics.
What is Supply Chain Analytics?
Let’s start by defining it.
Supply Chain Analytics is the discipline that uses data, statistical techniques, artificial intelligence and analytical models to monitor, understand and optimise supply chain performance. It integrates information from procurement, inventory, production, logistics, transportation, suppliers and demand to identify patterns, anticipate risks, improve planning and support decision-making.
Its objective is to increase operational efficiency, reduce costs, minimise disruptions, optimise inventory levels and improve customer service through the use of descriptive, predictive and prescriptive analytics.
The complexity of Supply Chain Analytics
So, how complex is the analysis of data generated by the supply chain? I think the following image illustrates it quite well.
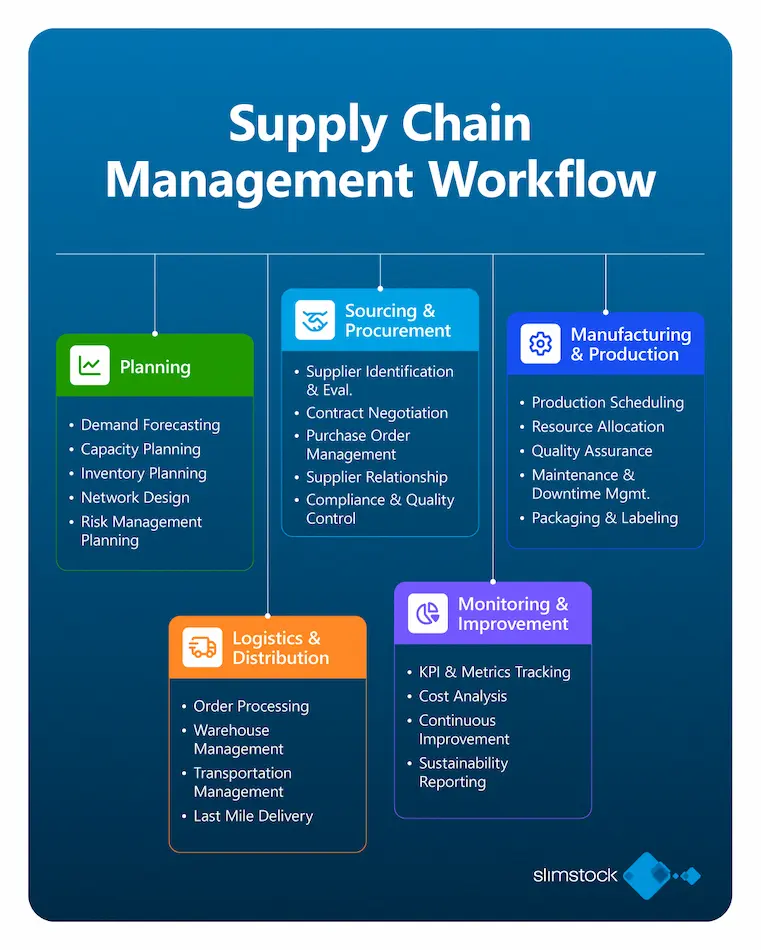
This diagram showing the tasks and subtasks that make up Supply Chain Management (SCM) clearly illustrates the complexity of managing the supply chain in an integrated way.
As you would expect, each of these areas works with its own data and generates additional data as a result. For example, planning teams generate and work with information relating to demand forecasting, inventory management and capacity reports; procurement teams work with supplier reports, contracts and quality controls; manufacturing teams generate production schedules and resource allocation plans; while logistics and distribution teams manage order processing and warehouse management data.
And the list goes on. We could identify many other reports linked in one way or another to organisations’ supply chains.
Supply Chain Analytics: what types of analysis can we carry out?
Now that it is clear that the supply chain generates vast amounts of data, the next question is: what is it used for?
On its own, and when interpreted in isolation, data is of limited use. However, through effective analysis, we can extract valuable insights that help us make better decisions across the supply chain.
There are four main types of analysis.
Descriptive analytics
Descriptive analytics is the starting point for understanding what is happening within the supply chain. Its purpose is to transform historical and current data into information that provides a clear view of operational performance.
This type of analysis mainly answers questions such as: What has happened? When did it happen? And how is the supply chain performing?
To achieve this, businesses analyse indicators and data from different areas, including inventory levels, sales, demand, procurement, deliveries, production and transportation.
For example, through descriptive analytics we may identify that inventory levels have increased by 15% over the last six months, that certain suppliers are consistently experiencing delivery delays, or that the number of stockouts has increased within a specific product category.
Some of the most common tools used for this type of analysis are dashboards, reports, management information systems and Business Intelligence solutions, which enable information from multiple sources to be consolidated and visualised in a simple way.
Diagnostic analytics
If descriptive analytics allows us to understand what has happened within our supply chain, diagnostic analytics goes a step further by identifying why it happened.
The objective is to discover the causes behind specific behaviours, deviations or problems within the supply chain. To do this, data from different sources is combined and analysed to identify relationships, patterns and trends that may not be immediately obvious.
For example, if descriptive analytics identifies an increase in stockouts, diagnostic analytics can help determine whether the root cause is an inaccurate demand forecast, supplier delays, longer lead times, an unsuitable inventory policy or an unexpected increase in sales.
This type of analysis is particularly useful for identifying bottlenecks, detecting inefficiencies and uncovering the root causes of problems. Common techniques include correlation analysis, data drill-downs, variance analysis and comparisons across different periods, products, suppliers and locations.
ESPA improves data structure and decision-making with Slimstock
The implementation of Slim4 Supply Chain enabled ESPA to start with one of the fundamental pillars of any planning process: data quality.
The company succeeded in parameterising critical information such as supplier lead times, minimum inventory levels and ABC product classifications, creating a solid foundation for decision-making.
With reliable and properly structured information in place, the team was able to optimise demand planning and replenishment processes, gaining greater visibility into which materials were required, when they needed to be purchased and how to anticipate market requirements.
Predictive analytics
Predictive analytics takes Supply Chain Analytics a step further than descriptive and diagnostic analysis. If those approaches help us understand what happened and why it happened, predictive analytics seeks to answer another question: what is likely to happen in the future?
To do this, it uses historical data, behavioural patterns, internal and external information, as well as statistical and AI-based techniques, to generate forecasts across different areas of the supply chain. The objective is not to predict the future, but to estimate different scenarios and probabilities in order to anticipate them.
One of its main areas of application is demand forecasting. Using historical sales data, seasonality, promotions, trends and other relevant factors, predictive models can estimate future demand for a product.
However, its applications extend much further. Predictive analytics can also be used to anticipate supplier delays, identify potential stockouts, forecast inventory requirements and detect risks of disruption within the supply chain.
For example, if a predictive model identifies that certain products are highly likely to run out of stock over the coming weeks, the planning team can take action before a stockout occurs. Similarly, if data points to an increasing risk of supplier delays, the organisation can evaluate alternatives before the issue affects customer service.
Prescriptive analytics
Prescriptive analytics takes Supply Chain Analytics one step beyond predictive analytics. Whilst predictive analytics seeks to anticipate what may happen, prescriptive analytics aims to answer an even more important question: what should we do about it?
To achieve this, it combines data, predictive models, business rules and optimisation techniques to evaluate different alternatives and recommend the actions most likely to deliver the best outcome.
In this way, it not only enables organisations to anticipate potential problems but also to identify the most appropriate response.
For example, if a predictive model anticipates an increase in demand for a particular product, prescriptive analytics can recommend how much additional stock should be held, when a replenishment order should be placed and which supplier should be used.
This type of analysis can be applied to many decisions within the supply chain, including inventory optimisation, procurement planning, resource allocation, transportation, production, distribution and supplier management.
The foundation of Supply Chain Analytics: clean and reliable data
For Supply Chain Analytics to generate useful insights for decision-making, having large quantities of data is not enough. The quality of the information, how well it is structured and the ability to identify relevant patterns are some of the factors that determine the true value of analytics within the supply chain.
Data collection and integration
The first step is to identify and collect relevant supply chain data. This information can come from multiple sources, including ERP, WMS and TMS systems, planning platforms, CRM systems, suppliers and even external market data sources.
The challenge is not simply having access to large amounts of information, but ensuring that data from different areas is connected and can be analysed together.
A disconnected view of procurement, inventory, production or demand may provide useful insights, but it is unlikely to deliver a complete understanding of how the supply chain operates as a whole.
Data cleansing and preparation
Once data has been collected, it must be checked to ensure that it is reliable, consistent and suitable for analysis. Organisational systems often accumulate duplicate, incomplete, outdated or inconsistently formatted information.
A common example is product master data. Duplicate product references, inconsistent units of measure, incorrectly linked suppliers or information that has not been properly updated can distort the results of any subsequent analysis.
For this reason, data cleansing and standardisation is a critical stage. Even the most sophisticated analysis will produce unreliable results if it is based on poor-quality data.
Conclusion: Good data is essential for Supply Chain Analytics
You cannot build a stable structure without solid foundations. Equally, Supply Chain Analytics cannot function effectively if your data is not properly organised.
Given the vast amounts of information generated by organisations today, the task may seem monumental. There is no doubt that achieving clean, reliable and consistent data requires effort and a clear commitment from the organisation.
However, AI can play a major role in simplifying this process. Agentic Data Management is a good example of this.
Bringing order to your data requires an investment of time and resources in the short term, but it will deliver substantial benefits in both the medium and long term. In addition, having your supply chain analytics operating at its full potential will enable faster, more informed decision-making, providing a significant competitive advantage over other organisations in your sector.